Rwanda · Analysis period 1960 to 2030
Methane from Rwanda's solid waste disposal sites, 1960 to 2030.
A Tier 2 estimate of methane emissions from solid waste disposal sites in Rwanda from 1960 to 2030, using the IPCC First Order Decay model, as a component of carbon accounting for the waste sector.
Formal title: Waste Emission Modelling: Solid Waste Disposal Sites (SWDS), Rwanda
Satellite view: The Virunga volcanic chain, Envisat radar composite, Rwanda, Uganda and DR Congo. Image: ESA, Envisat, CC BY-SA 3.0 igo, via Wikimedia Commons. Shown for the landscape, not as a record of the project.
The question
How much methane do Rwanda's solid waste disposal sites release, and how will that change to 2030? Methane from decomposing organic waste is a major part of the waste sector's contribution to a national greenhouse gas inventory, and it builds up over decades rather than years.
Method
The study applies the IPCC First Order Decay (FOD) model, which assumes that the degradable organic carbon in deposited waste breaks down gradually, producing methane and carbon dioxide, with emissions highest in the first decades after deposition and declining as the carbon is consumed. Because the model needs at least fifty years of data to be tolerably accurate, waste deposition was reconstructed from 1960 and projected to 2030.
Of the three IPCC tiers, the study uses Tier 2: country-specific, high-quality activity data on past and present waste disposal, combined with IPCC default parameters.
Results
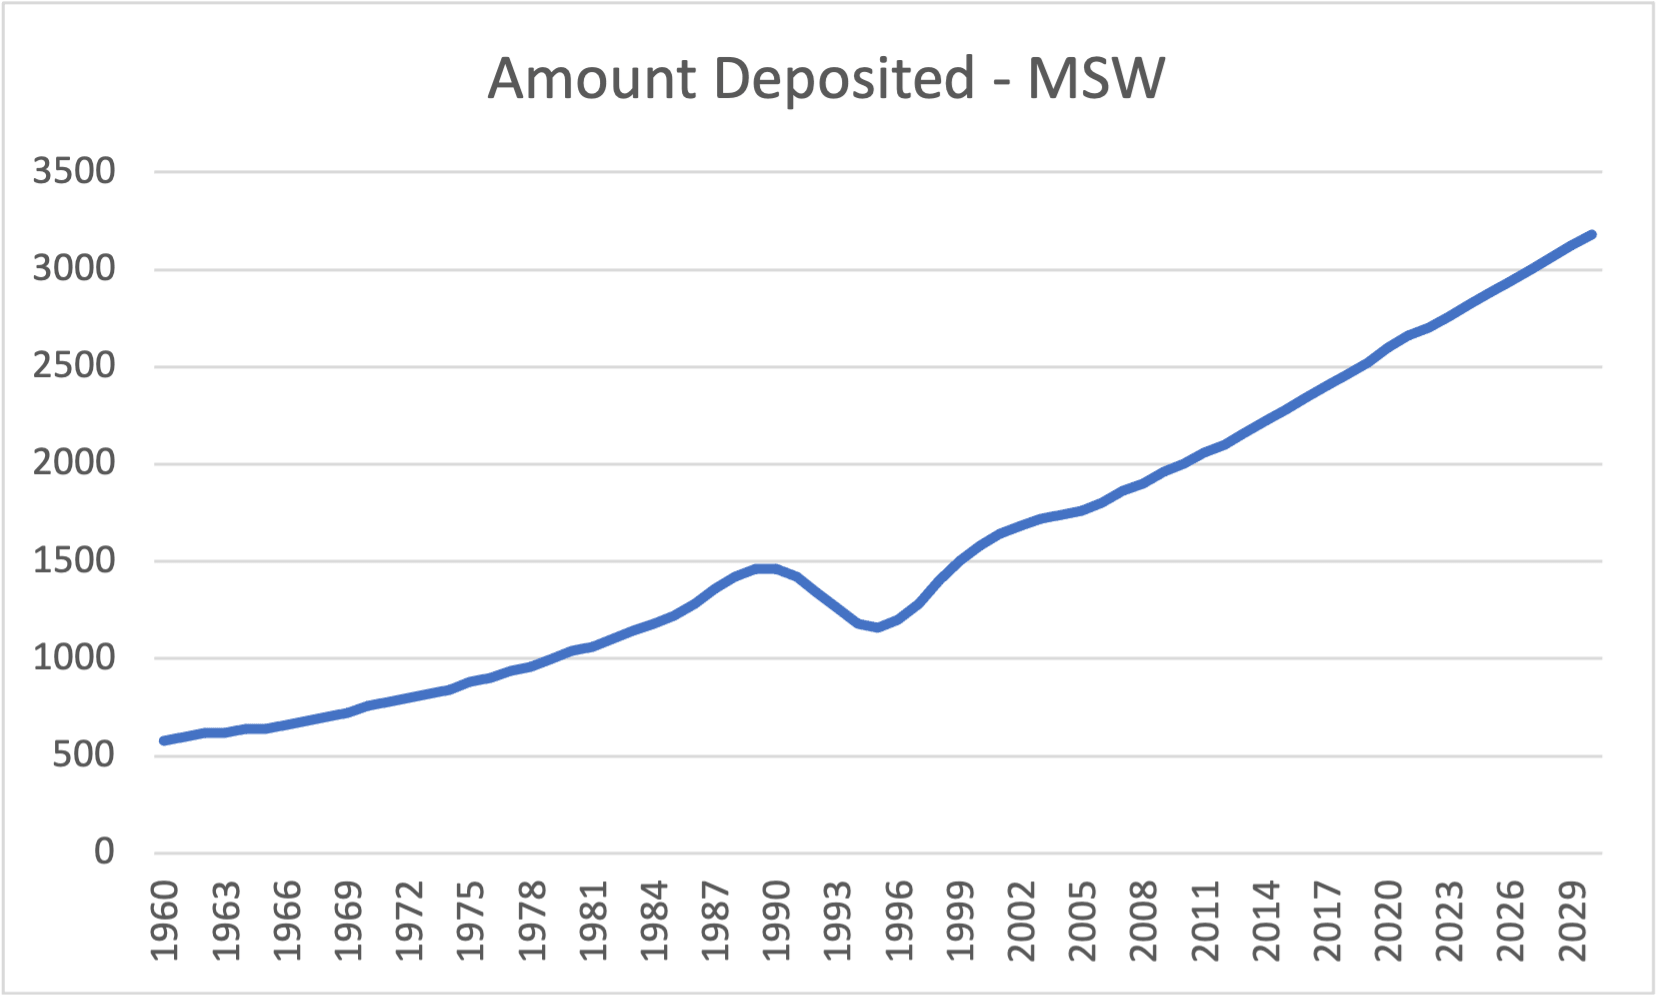
- Municipal solid waste deposited in disposal sites rose from an estimated 580 Gg in 1960 to 1,041 Gg in 1980, 1,581 Gg in 2000 and 2,601 Gg in 2020, and is projected to reach 3,182 Gg in 2030.
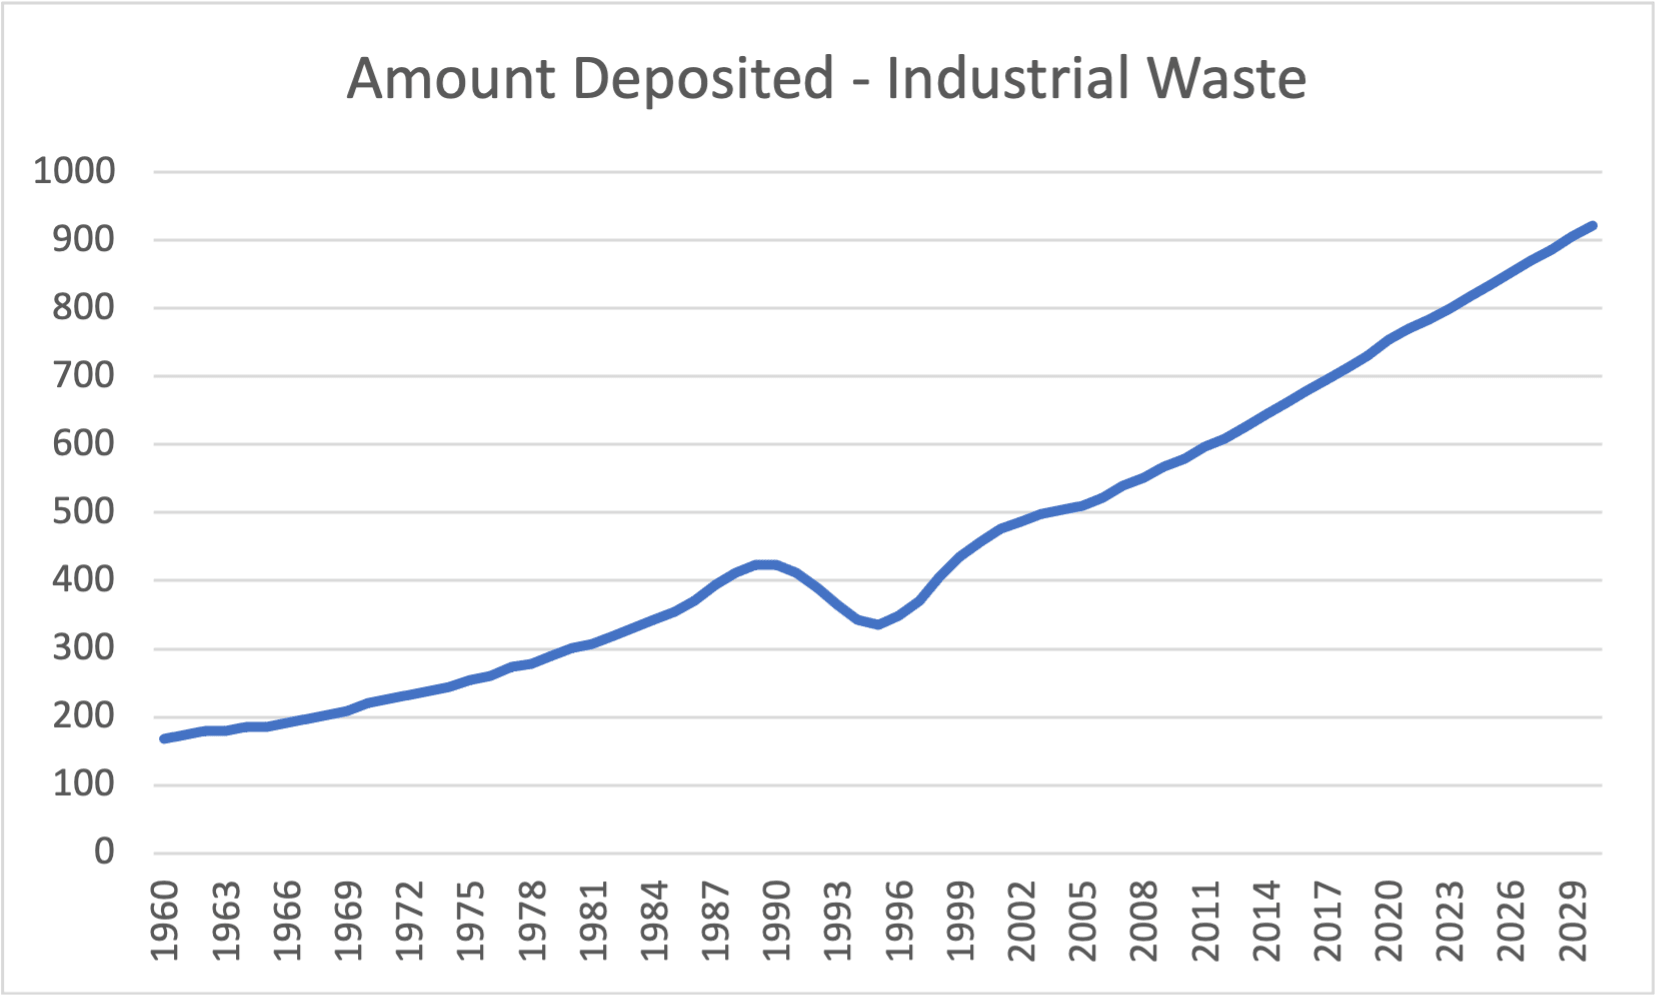
- Industrial waste deposited rose from 168 Gg in 1960 to 302 Gg in 1980, 458 Gg in 2000 and 754 Gg in 2022, with 922 Gg projected for 2030.
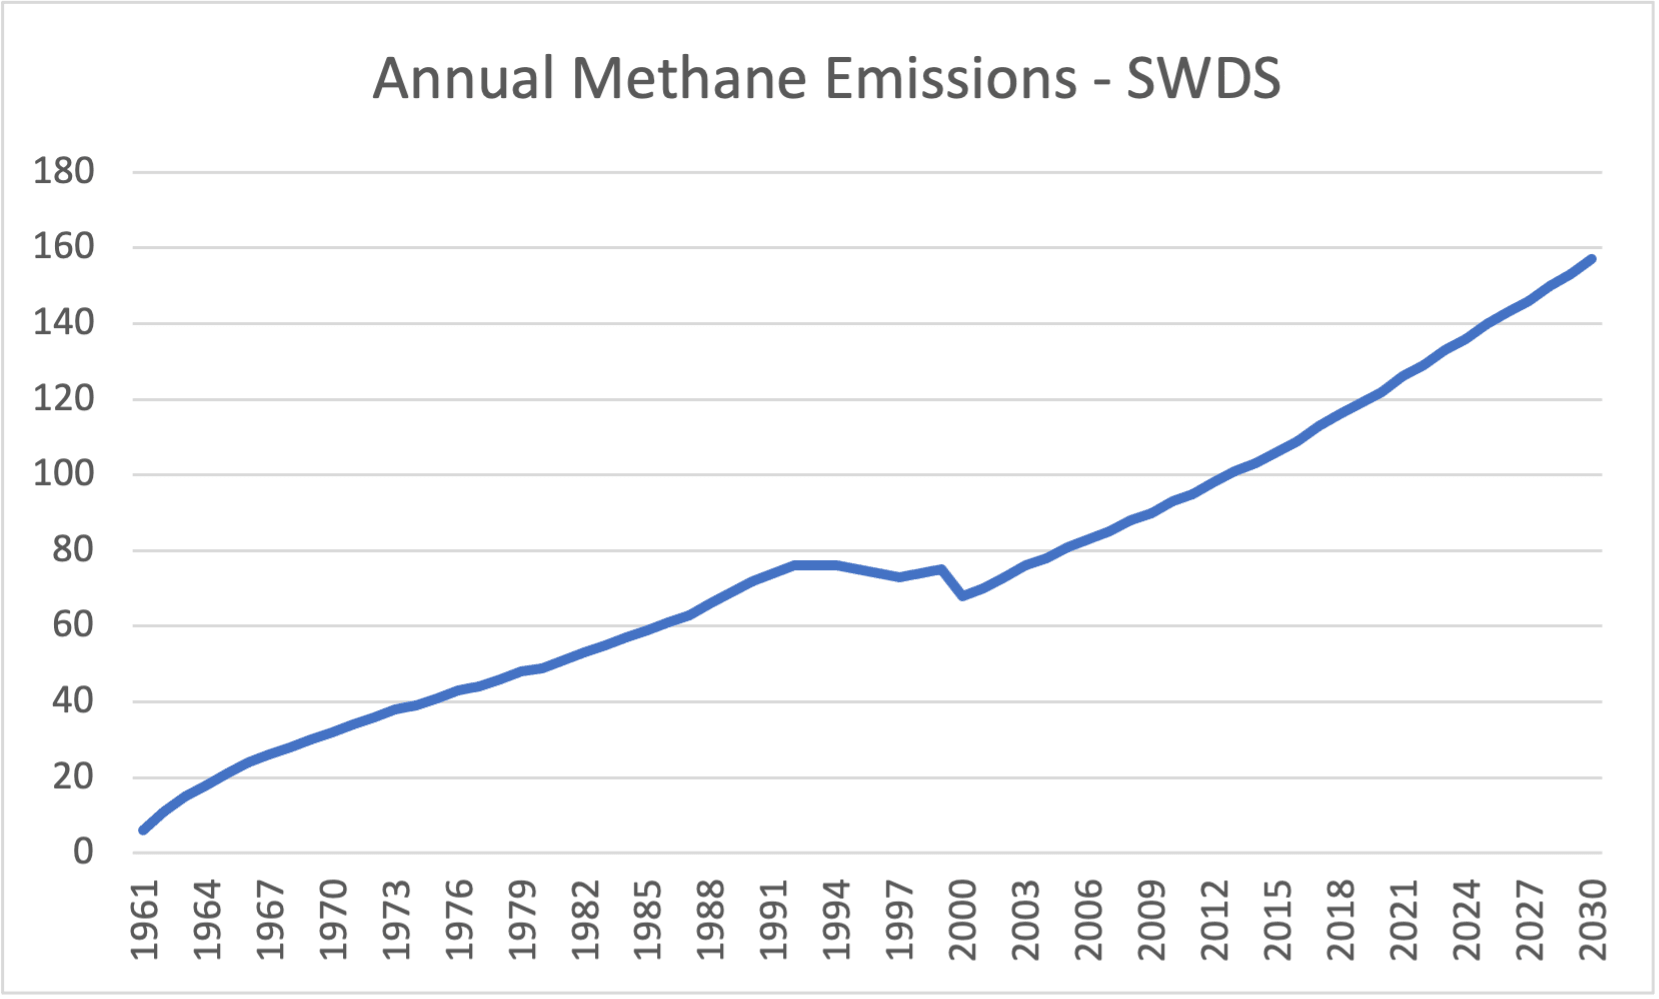
- Annual methane emissions from disposal sites grew from 28 Gg CO2-eq in 1965 to 49 Gg in 1980, 68 Gg in 2000 and 122 Gg in 2020, and are projected to reach 157 Gg CO2-eq in 2030.
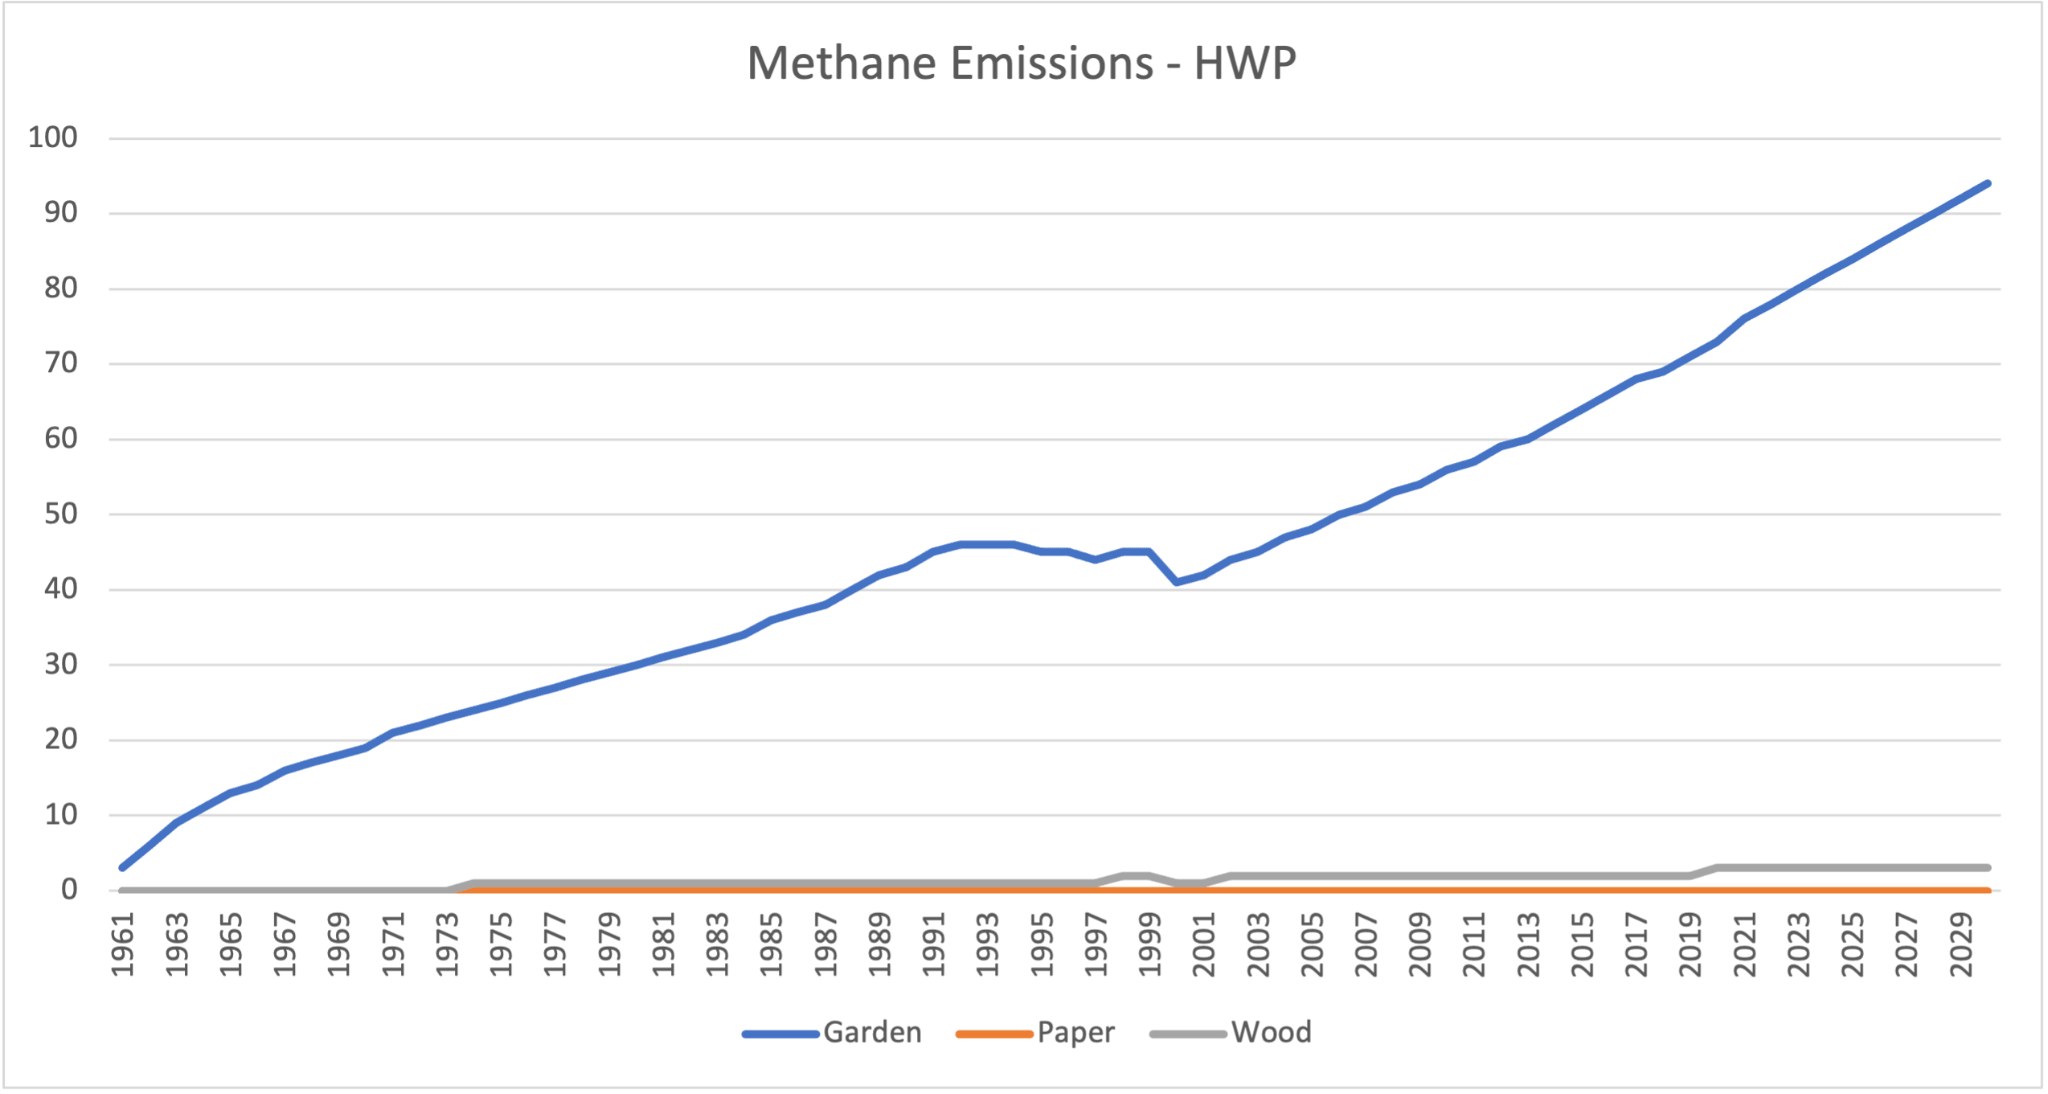
- Within harvested wood products, garden waste dominates: 13 Gg CO2-eq of methane in 1965, 45 Gg in 1999, 73 Gg in 2020 and a projected 94 Gg in 2030, against 3 Gg from wood products and negligible amounts from paper.
Team
The modelling was carried out by Ekaba Bisong and Taiwo Adediran.
Outputs
Related
 ImpressionStudy
Nigeria · African Development Bank (AfDB & Dutch RVO)
Nigeria's transition to a green economy.
A detailed evaluation of the current landscape for transitioning Nigeria from an unsustainable linear economic model to a circular model along critical sectors, and of the public-private partnership investments that link circularity to natural capital.
Read the case ImpressionFramework
Nigeria · African Development Bank (AfDB & Dutch RVO)
A roadmap framework for a circular Nigeria by 2050.
Built on a Theory of Change, the framework sets out the strategies and activities to be carried out towards transitioning Nigeria to a circular economy in 2050, accompanied by an MRV policy brief and a policy brief.
Read the case ImpressionReport
Nigeria · African Development Bank (AfDB) · December 2020 to March 2021
Waste and circular economy analysis for Nigeria's enhanced NDC.
Analysis of greenhouse gas emissions from waste management in Nigeria and of the circular economy's impact on them, for the enhancement of the country's Nationally Determined Contribution for 2021 to 2025.
Read the case